数据集描述
|
1 |
<label> <index1>:<value1> <index2>:<value2> ... <indexN>:<valueN> |
Classification class is something like true/false; 0,1,... Here you need to transform it into integers (e.g. 0,1).
Feature space is a space for your multidimensional data. Each feature (vector) should have its own ID (index) and its value. E.g. 1:23.2 means that feature/dimension 1 has value 23.2.
a) Index merely serves as a way to distinguish between the features/parameters. In terms of a hyperspace, it's merely designating each component: Eg: 3-D ( 3 features) indices 1,2,3 would correspond to the x,y,z coordinates.
b) The correspondence is merely mathematical, when constructing the hyper-plane, these serve as coordinates(坐标).
如果使用libsvmread语句,那么数据以稀疏数组或者稀疏矩阵的形式存储的。( Essentially, it means only the non-zero data are stored, and any missing data is taken as holding value zero.)
|
1 2 3 |
dirData='../libsvm-3.20'; addpath(dirData); [heart_scale_label, heart_scale_inst] =libsvmread(fullfile(dirData,'heart_scale')); |
实际应用
|
1 2 3 4 5 6 7 8 9 10 11 12 13 14 15 16 17 18 19 20 21 22 23 24 25 26 27 28 29 30 31 32 33 34 35 36 37 38 39 40 41 42 43 44 45 46 47 48 49 50 51 52 53 54 55 56 57 58 59 60 61 62 63 64 65 66 67 68 69 70 71 72 73 74 75 76 77 78 79 80 81 82 83 |
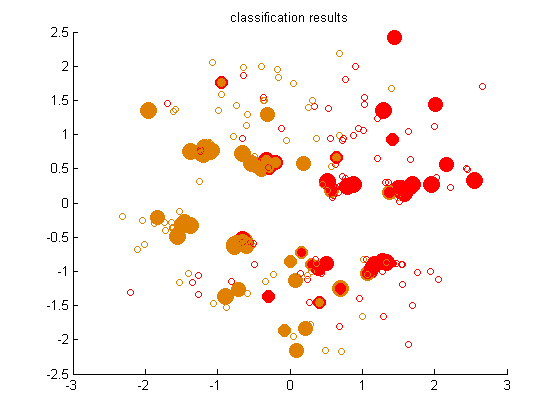
clc; dirData='../libsvm-3.20'; addpath(dirData); [heart_scale_label, heart_scale_inst] =libsvmread(fullfile(dirData,'heart_scale')); %读取heart_scale矩阵文件,label放入heart-scale-label变量中,矩阵放入heart-scale-inst变量中。 [N D] = size(heart_scale_inst); %读取矩阵大小,行数放入N,列数放入D。 % Determine the train and test index trainIndex = zeros(N,1); trainIndex(1:200) = 1; %建立N行1列的0矩阵,将前200行赋值1 testIndex = zeros(N,1); testIndex(201:N) = 1; %建立N行1列的0矩阵,将201行至最后赋值1 trainData = heart_scale_inst(trainIndex==1,:); %将heart矩阵的前200行数据赋值给traindata trainLabel = heart_scale_label(trainIndex==1,:); %将heart的前200行label赋值给trainlabel testData = heart_scale_inst(testIndex==1,:); %将heart矩阵200行之后赋值给testdata testLabel = heart_scale_label(testIndex==1,:); %将heart200行之后label赋值给testlabel % Train the SVM model = svmtrain(trainLabel, trainData, '-c 1 -g 0.07 -b 1'); %训练模型,-c损失参数(对错误惩罚程度),-g核函数gamma函数设置,-b是否计算概率估计,0不计算1计算 % Use the SVM model to classify the data [predict_label, accuracy, prob_values] = svmpredict(testLabel, testData, model,'-b 1'); % run the SVM model on the test data % Assign color for each class % colorList = generateColorList(2); % This is my own way to assign thecolor...don't worry about it产生2分类的颜色列表 %prism 光谱色图矩阵 colorList = prism(100); % true (ground truth) class trueClassIndex = zeros(N,1); trueClassIndex(heart_scale_label==1) = 1; trueClassIndex(heart_scale_label==-1) = 2; colorTrueClass = colorList(trueClassIndex,:); % result Class resultClassIndex = zeros(length(predict_label),1); resultClassIndex(predict_label==1) = 1; resultClassIndex(predict_label==-1) = 2; colorResultClass = colorList(resultClassIndex,:); % Reduce the dimension from 13D to 2D distanceMatrix = pdist(heart_scale_inst,'euclidean'); newCoor = mdscale(distanceMatrix,2); % Plot the whole data set x = newCoor(:,1); y = newCoor(:,2); patchSize = 30; %max(prob_values,[],2); colorTrueClassPlot = colorTrueClass; figure; scatter(x,y,patchSize,colorTrueClassPlot,'filled'); title('whole data set'); % Plot the test data x = newCoor(testIndex==1,1); y = newCoor(testIndex==1,2); patchSize = 80*max(prob_values,[],2); colorTrueClassPlot = colorTrueClass(testIndex==1,:); figure; hold on; scatter(x,y,2*patchSize,colorTrueClassPlot,'o','filled'); scatter(x,y,patchSize,colorResultClass,'o','filled'); % Plot the training set x = newCoor(trainIndex==1,1); y = newCoor(trainIndex==1,2); patchSize = 30; colorTrueClassPlot = colorTrueClass(trainIndex==1,:); scatter(x,y,patchSize,colorTrueClassPlot,'o'); title('classification results'); |

结果
|
1 2 3 4 5 6 7 8 9 10 11 12 13 |
* optimization finished, #iter = 93 nu = 0.470980 obj = -63.270339, rho = 0.458209 nSV = 83, nBSV = 67 Total nSV = 83 * optimization finished, #iter = 137 nu = 0.457422 obj = -76.730867, rho = 0.435233 nSV = 104, nBSV = 81 Total nSV = 104 Accuracy = 81.4286% (57/70) (classification) |